P-value, hypothesis testing, statistical significance, or statistical tests are words you hear most of the time especially if you are a Data Scientist. You can find all these definitions in multiple Medium posts and YouTube videos that have covered just part of these concepts and put away others to read. So as notations change, the reader may get confused about the main ideas. So I decided to write a post which covers all related concepts about statistical test in a short and straightforward way.
Let’s start our journey with an example. Pizza Time!
🍕 🍕 Example: Suppose a fast-food claim that its delivery services are 30 minutes or less on average. it is what expected and all people think about that. But as you are a curious person, you wanna test this idea.
- There is a claim (delivery services are 30 minutes or less on average) that we want to test it. We call it a Hypothesis.
- There is an accepted claim which says delivery services are 30 minutes or less on average. We call this Null-Hypothesis. Null-hypothesis is currently acceptable.
- You have an idea which says, delivery services may are more than 30 minutes on average. So you should make a test. As a result, then you can accept the claim(null-hypothesis) or reject it. Your claim is called Alternative-Hypothesis. Be aware that you test fast-food’s claim and you decide whether to accept or reject that.
Now you should choose a threshold that shows the confidence of your test. You wanna be 99% sure then level of confidence should be 0.99. You should decide before you start an experiment.
Start sampling from the delivery service. your samples are independent and you gather enough (more than 30) samples. Your samples are randomly chosen and have a normal distribution.Until now you have defined your problem. you have a null hypothesis and an alternative one and enough random samples. Suppose we want 95% confidence that means 0.05 variation from normal status is significant to you. We call this significant level (alpha). this means the parameter is abnormal if it crosses a threshold (alpha).We first transform our sample. Why? because we want to have a simply unique and intelligible metric to understand. As samples are from normal distribution we choose Standard Normal Distribution ( mean =0 and std =1 ). It is just we can simply transform our data from any normal distribution to Standard normal distribution. now z-score appears (this part is borrowed from mathbitsnotebook.com). A z-score (or standard score) represents the number of standard deviations a given value x falls from the mean, μ.

“def. z-score is a measure of position that indicates the number of standard deviations a data value lies from the mean. It is the horizontal scale of a standard normal distribution.”

Areas under all normal curves are related. For example, the area percentage to the right of 1.5 standard deviations above the mean is identical for all normal curves. The area percentage (proportion, probability) calculated using a z-score will be a decimal value between 0 and 1 and will appear in a Z-Score Table. The total area under any normal curve is 1 (or 100%). Since the normal curve is symmetric about the mean, the area on either side of the mean is 0.5 (or 50%).
the probability that a variable has a z-score of less than 0.36.
Imagine we have a sample and we compute z-score for it called z. on the other hand, find z-score for alpha parameter called zc. if z cross zc, it means we have significant distance from the mean(0) and it is kind of abnormal event. The higher or lower the Z-score, the more unlikely the result is to happen by chance, and the more likely the result is meaningful. Be aware alpha is the area under the curve from zc to right. (we test on the right tail.)
p-value is probability of obtaining a sample more extreme than we observed in our sample when we accept null hypothesis. here’s a p% chance we would see the average delivery time is longer due to random noise.
So if we have lower p, we can say with more chance this event does not happen due to noise. If p is small enough( from a threshold which we set before called alpha), we can reject our null hypothesis because it is ridiculed we have an abnormal event( we accept null hypothesis is true) that has a low chance to happen by random noise. It is not affected by noise but it really happens and it is not like our first claim.
So our sample z-score cross the zc (where the area under cure to right part is alpha in a standard normal distribution) and the area of the curve from this z-score to right of the standard normal distribution is our p-value. So if the p-value is lower than alpha(significant level) then we call event abnormal. Then we can reject our null hypothesis.
But one last thing. you see sqrt(n) in the formula of z-score in most tutorials. What is this sqrt(n) for?

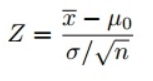
If X is a normal random variable, you can record an observation of it, and compare it to the mean. The usual way to do this is to standardize the variable, i.e.,


Let’s say that X1, X2,…Xn are random variables from the same distribution as XX above. If we record observations of each and calculate the mean, that’s also a random variable. However, we can’t expect the mean, our new random variable to have the same distribution as our original distribution. It will have the same mean, but it won’t have the same variance. To have an intuition, if you grow n enough, and then make different groups of your samples, the average in each group is a random variable with the same mean distribution, but the averages get closer to each other because they blur outliers data. (just think about it again to get an intuition). Actually the variance divided by n. So the formula change that way.
Now you understand the definition of all the words you need in a statistical test.

